A model of everything
Challenges with building models of an entire business

Every once in a while, I get the urge to build what I’ve started calling a model of everything. My colleagues and I are considering building one soon, and this is a bit of a post where I’m working through my research and thought process. As much as I’ve tried to find other sources, I can’t find anyone who has quite defined the class of model that I have in mind. Yet I see these models, or the idea of them, occasionally, and I’ve seen them work well or work poorly. I’m going to explain the models I have in mind, using three examples of where they apply.
What is a model of everything? Well, let’s work our way up through models of something.
For a moment, imagine you're a cloud services provider.1 You have some kind of big-picture goal, like maximizing profit or expanding market share, or perhaps maximizing some function of the two. There are some things you control, like your prices, and some things you don’t, like the biggest trends in the economy.
Note that in this context, we aren’t just trying to observe profit, we’re trying to cause profit. We’re beyond purely observational forecasting. This puts us in the harder realm of causal forecasting, where we have the possibility of changing the world around us. To observe is one thing, but to act is another entirely.
As part of this cloud services business, these days you likely predict a large number of outcomes. How much of each compute resource will be consumed at any given time, in aggregate. How much of each compute resource will be consumed by any existing or potential customer. Whether a customer will accept an incentive you offer to join the platform or use an additional service. Whether a customer is at risk of leaving. CPU usage, memory consumption, database reads and writes. Latency, fault likelihood. Service abuse, hacking attempts. This is just a taste from the flavour profile of models that might be relevant for the business. These are some of the things you could predict. Each one could be predicted with a model of something. Most of our models don’t actually predict the ultimate goal we care about, such as profit. We predict intermediate outcomes, like whether some usage is malicious or whether a user will accept an incentive.
How do we know what actions to take? Should our incentive increase or decrease? How much hardware should we buy? How should we set prices for each type of resource? Under what conditions should we give out free credits; when will they turn into permanent incremental users and when will they turn into unwanted crypto mining?
These are hard questions. Most of us tackle them independently. We often solve them outside of our models. We run A/B tests, holding the rest of the business constant as we change individual pieces. Sometimes we run those experiments for longer durations to see long-term effects, and sometimes we assume away those effects. Maybe we use long-term holdout samples, which stay behind on an entire vintage of changes. Maybe not. Maybe we come back to experimentally re-verify our earlier successful experiments. Maybe not.
For the most part, we locally optimize our way through the parameter space of our business, while the surface of outcomes shifts under us as the world changes, and we hope that we’re not mistakenly diverging from the global optimum.
That approach is popular because it is practical. But at times you can’t feel satisfied with it. Your intellectual hunger and your ego push you to another one: why can’t it all be combined in one big model? The model could predict the final goal—such as profit—and every single choice we have is an input to the model. It could have intermediate models contained within it. You maximize profit for the business by choosing values for the controllable inputs which maximize the model’s prediction. If you can find this model, you’ve solved your business.
That’s a model of everything.
A more specific definition
Models of everything have most or all of these properties:
They predict the final (downstream) goals that the company cares about
They predict intermediate (upstream) goals, useful for introspecting the predicted scenario and the dynamics of the model
The upstream and downstream predictions are collectively coherent
The models are causal and not merely observational, allowing for changes to inputs
Their breadth of inputs covers the significant changes available for the business to make
If we add one more criteria, that the model is fit on data with ML models, I’ll call that an ML model of everything.
A motivating example from Lyft
Before I go further, I’ll briefly discuss an example that I find illustrative and inspiring. Duane Rich and Sameer Manek wrote a pair of blogs about a system they built at Lyft (first blog, second blog).2 Them having a deep understanding of the problem has helped me get my head around it.
Their system includes a number of individual models, which collectively form a causal hierarchy. To use part of their system as an example, they predict the weather, they predict the number of drivers on Lyft and their general availability, and they then use those models to predict driver time available in a given time period. They have similar models for the rider side of the market, which they then join with the driver side to influence both pricing and the number of rides. Ultimately this system of models builds up from unconditional inputs all the way to predicting the entirety of activity on Lyft (“the inputs are our control variables and the outputs are everything downstream”) [1].

This directed acyclic graph (DAG) explicitly “communicates the function of our business”, because the edges in the graph have been chosen intelligently to model the causal relationships in Lyft’s ridesharing marketplace.
If the model is sufficiently accurate, its users can answer how changes in an input, such as the pricing parameters chosen or the discounts (coupons) offered to riders, will ultimately affect rides, prices, and total revenue.
Foundational choices in building a model of everything
There are big obstacles to models of everything. The causal connection between, say, our company’s revenue and whether we mark a message as spam or not is so convoluted and long that our models might only learn noise. It’s a lot more concrete to just predict whether recipients mark messages as spam, and then to use a combination of data and human judgement to understand how to use that model effectively.
Long causal chains are hard to model accurately, and they also introduce the risk of defining relationships that aren’t truly causal. Any one mistake in the causal structure can significantly damage the entire model.
Given these challenges, we have to be strategic about introducing complexity in our model of everything.
We have to choose:
How much of “everything” to model
How connected the relationships should be
How connected the optimization strategy should be
How complex each individual model should be
The first one has an obvious effect on problem difficulty. If we model a larger scope of behavior and have more models to fit into the system, every step of the problem becomes harder. Shrinking scope to the smallest coverage that will still be useful is a way to make the problem more tractable. Most often we shrink it all the way to atomic units and avoid building a model of everything at all.
The next two big dimensions are connectedness of the relationships between models, and connectedness of the optimization.
Connectedness of the relationships is about models being used as inputs for other models. If we draw a graph of these models, their inputs, and their outcomes, how many edges are involved? Is the graph shallow (with each model only depending on basic inputs or models) or deep (with some models depending on a long chain of models that depend on other models)? Deep and highly connected graphs involve a lot of risk, where one bad interior model could damage large parts of the aggregate model.
Connectedness of the optimization is about whether we fit models separately or use a strategy to fit them all simultaneously. Fitting separately makes the task of optimizing each individual model more concrete and gives a clear criteria to optimize for each. Fitting jointly creates a large challenge: if we want a model of everything, do we have to evaluate its accuracy on every outcome? Do we optimize for particular final outcomes or for some weighting of all intermediate outcomes?
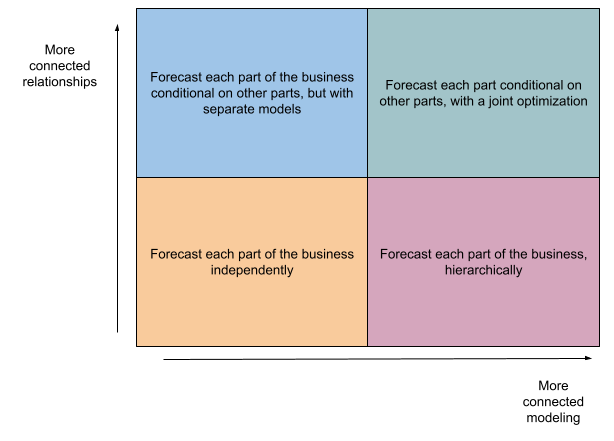
In the simplest setup, all of our models are independent and unconditional. We might be forecasting hundreds of outcomes, but the forecasts are separate, aren’t necessarily jointly coherent, and are unconditional on treatments. Just plain old fashioned forecasting with time-series models or pointwise classification or regression models.
On the more complex side, we may have models that are conditional on treatments we control, and that are all jointly optimized to guarantee coherence. This is the approach that Lyft took, where the second blog details how they carefully designed a joint optimization to fit observational data and experimental outcomes [2]. This is an incredibly ambitious path.
The fourth choice in my list is how complex each interior model should be. Simpler models are easier to reason about, and make the aggregate system more stable and easier to debug. The distributions of predictions and residuals can also be important for effects on downstream accuracy.
Another literature: Corporate financial models
Where I most often see models of everything is in the financial forecasting side of businesses. This is the part of large companies focused on at least having some forward-looking expectation of business performance. This might be under in a Finance team, or a Business Analytics team, or a Risk Management team. Often this is in a team that has a degree of separation from the product part of the business, focusing more on observational forecasts than causal choices.
In the corporate financial modeling literature we can find some theory and guidance on models of everything.
From the excellent book The Founder’s Guide to Financial Modeling, we can extract at least a few principles [3]:
A financial model is a simulation of a business
The model accepts a set of assumptions about the business and creates a projection or forecast of the financial performance of the business
A model is a quick, low-cost way to iterate on ideas
The first two principles sound similar to parts of my definition, while the third reflects one design choice that isn’t always present in other applications. Notably, in finance these models are usually coded in spreadsheets. The aforementioned source even refers to spreadsheets in the very first page of content, in their definition of a financial model; extending the quote from bullet (1) above, “a financial model is a simulation of a business, typically built in Microsoft Excel or Google Sheets”. The use of spreadsheets is so ingrained, that one of the clearest ways to describe these models is to explain that they use spreadsheets. There are some places where the easiest way to explain a financial model would be to say “It’s what ‘FY2023 revenue model Final v2 (REVISED).xlsx’ is”.
Another good source even goes so far as to highlight spreadsheets as their fifth and final principle of corporate financial models, explaining [4]:
A spreadsheet is an excellent programming venue for rules, accounting systems and scenario representation with dynamic variables. [Dynamic financial analysis] models can be segmented into components- the nodes serve as logical breakpoints among strains of causality. This chained quality of the models, even with feedback and dependency relationships, is easily expressed in spreadsheet components. The components may be as small as a single cell. Or, they may be aggregations of cells or sheets within a workbook. In any case, the components can be easily modified when they are expressed as elements of a spreadsheet.
Spreadsheets are a powerful programming environment, with a natural way of expressing the causality between different relationships, and with clear visibility to introspect such models. They also allow easy modification and scenario testing.
What they aren’t great for is machine learned models. For deriving models from data, spreadsheets work for finding unconditional or univariate models, but they become increasingly suboptimal for models with more features or more complex interactions.3
From spreadsheets to PyTorch
For the most part, I find that models of everything compress two dimensions (model complexity and relationship complexity) into a single spectrum.
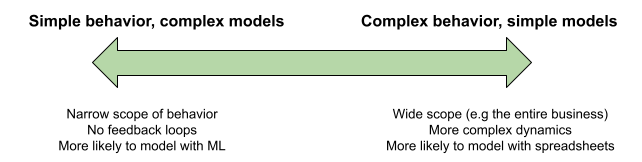
The more ambitious the model is in terms of reflecting the entire business or having more causal connections, the more likely it is to be modeled with spreadsheets. Corporate financial models are built with spreadsheets not out of naivety, but because the benefits of spreadsheets make them an appropriate tool for the job. On the other end, narrower scope means that we can get away with more complex machine learning models. Most scenarios fit near one of the two poles.
That’s something that makes the Lyft model particularly unique. It has big scope, and it incorporates interior models of varying complexity, and it fits the broader system with a hyperparameterized optimization in PyTorch. It’s not just a model of everything; it’s the rarer case of an ML model of everything.
For that type of approach, I’m still hunting for the right literature. I may have found some starting points [5, 6]. But the Lyft example is the only precedent I’ve seen of a model of everything in a relevant empirical setting (in this case, a marketplace facilitated by a tech company). I (selfishly) would like to see the disparate literatures of corporate financial modeling and causal graphical models unified in a cohesive framework. This is relevant for me right now because I’m tempted to make my own.
[1] Rich, D., & Manek, S. (2022, June 28). Causal Forecasting at Lyft (Part 1). Retrieved July 8, 2023, from https://eng.lyft.com/causal-forecasting-at-lyft-part-1-14cca6ff3d6d.
[2] Manek, S., & Rich, D. (2022, August 25). Causal Forecasting at Lyft (Part 2). Retrieved July 8, 2023, from https://eng.lyft.com/causal-forecasting-at-lyft-part-2-418f1febca5a.
[3] Lishego, D. (2019). The Founder’s Guide to Financial Modeling. Self-published.
[4] Kirschner, G., & Scheel, W. Specifying the Functional Parameters of a Corporate Financial Model for Dynamic Financial Analysis. Casualty Actuarial Society.
[5] Zecevic, M., Dhami, D.S., Velickovic, P., & Kersting, K. (2021). Relating Graph Neural Networks to Structural Causal Models. ArXiv, abs/2109.04173.
[6] Scherrer, N., Bilaniuk, O., Annadani, Y., Goyal, A., Schwab, P., Scholkopf, B., Mozer, M., Bengio, Y., Bauer, S., Ke, N. (2022). Learning Neural Causal Models with Active Interventions. ArXiv, abs/2109.02429.
Given the number of people who work for GCP or AWS or Azure, this could actually be you!
Separate from this topic: one of the authors, Duane Rich, has an awesome YouTube channel: https://www.youtube.com/@Mutual_Information.
Now that I write this sentence, I’m sure some deranged genius will implement transformers in spreadsheets. I hesitate to search for it, with the great fear that someone might have even done so already.